
Century 21 People’s Choice Realty Inc., Brokerage
120 MATHESON BLVD E #103
MISSISSAUGA, Ontario
L4Z 1X1


Milton, TM Timberlea, L9T 4K2
$1,375,000
Listed by RE/MAX REAL ESTATE CENTRE INC..
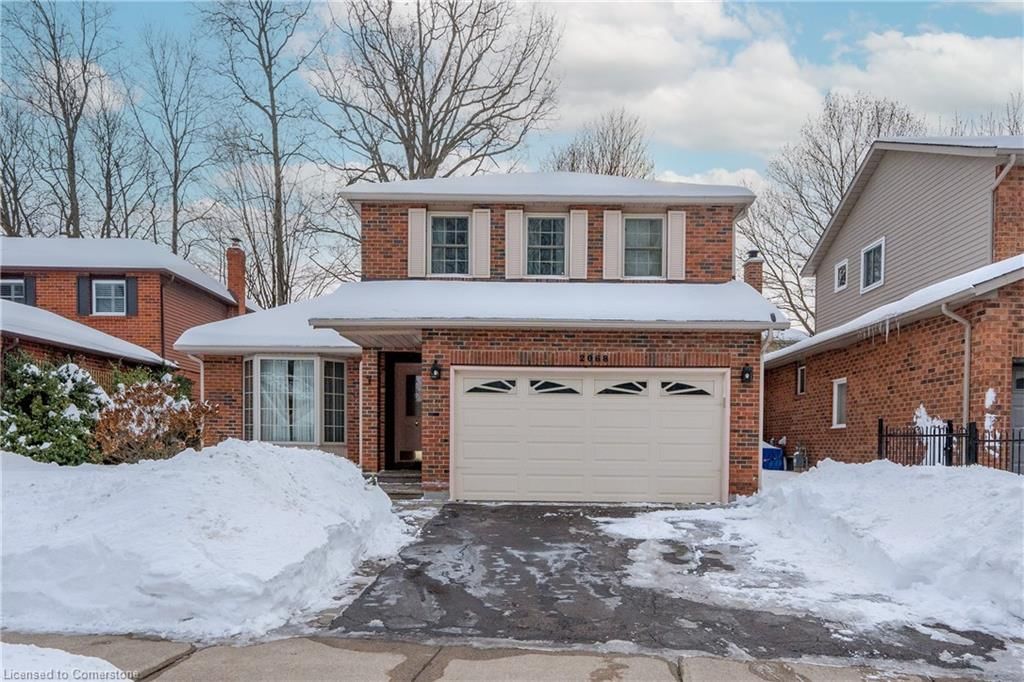
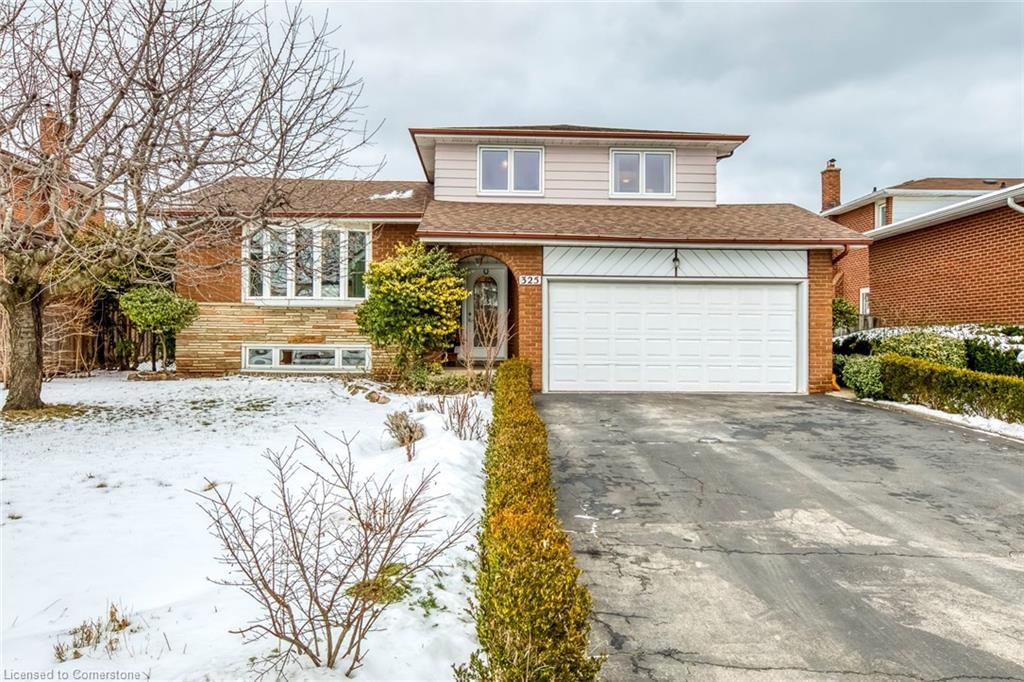
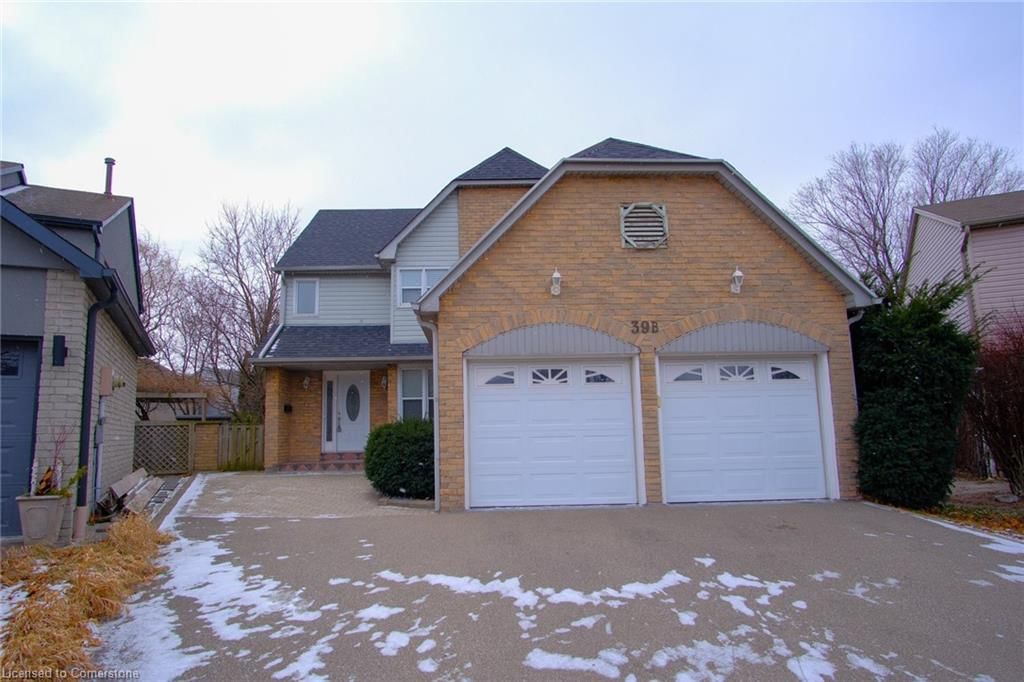
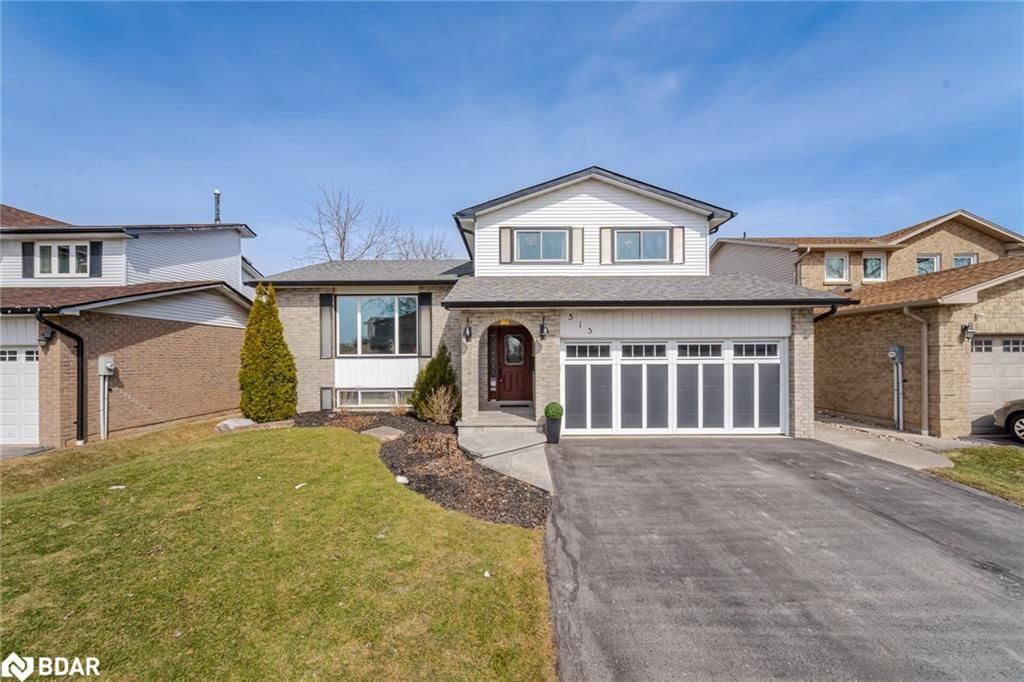
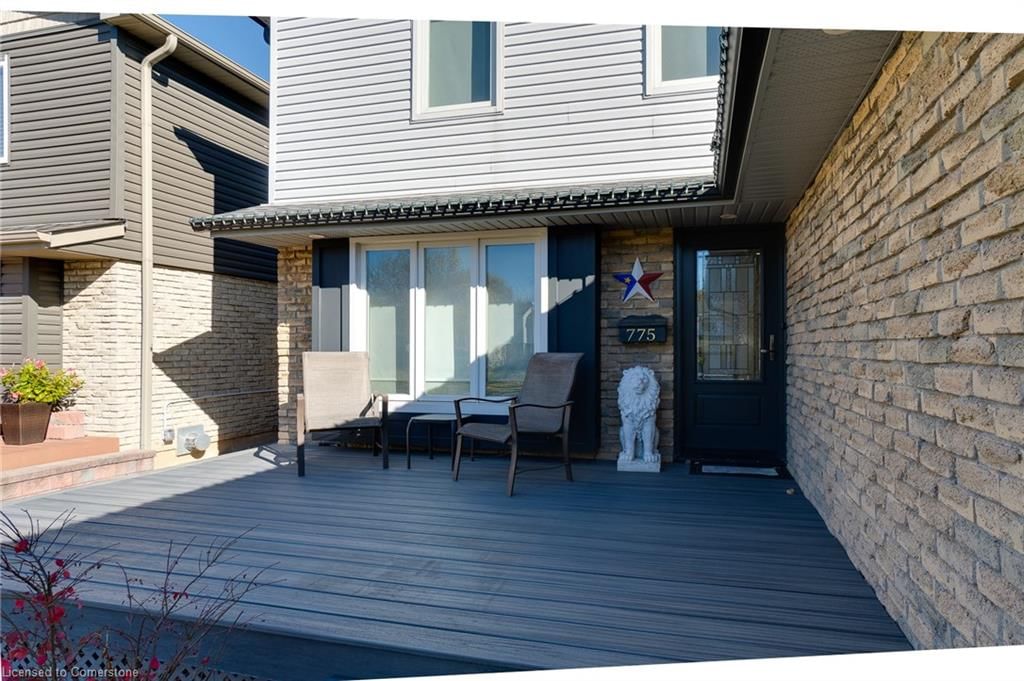
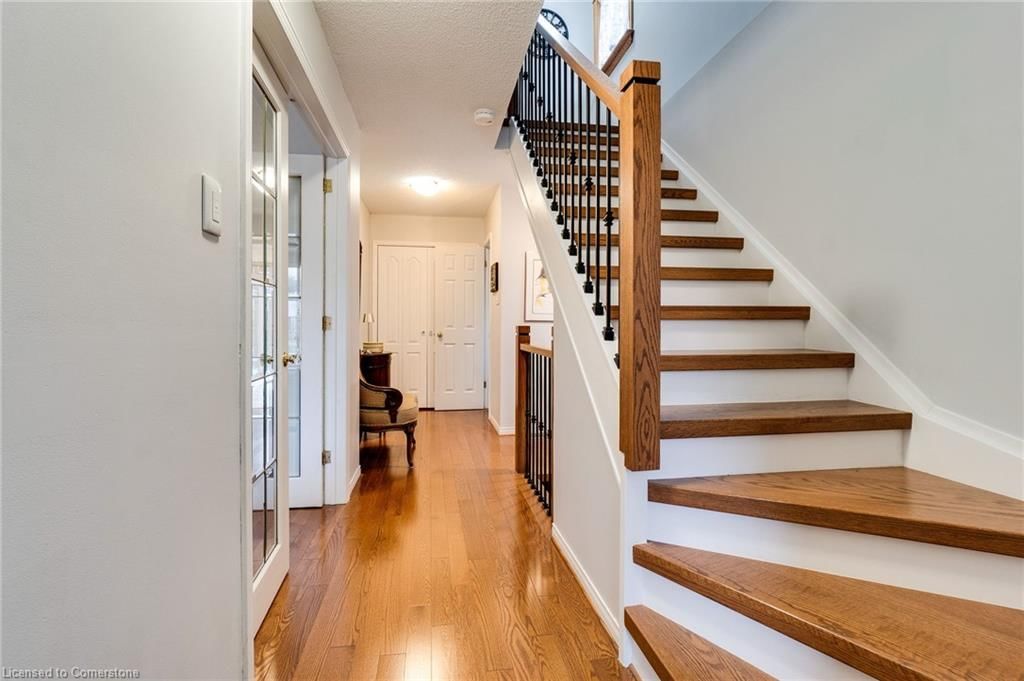
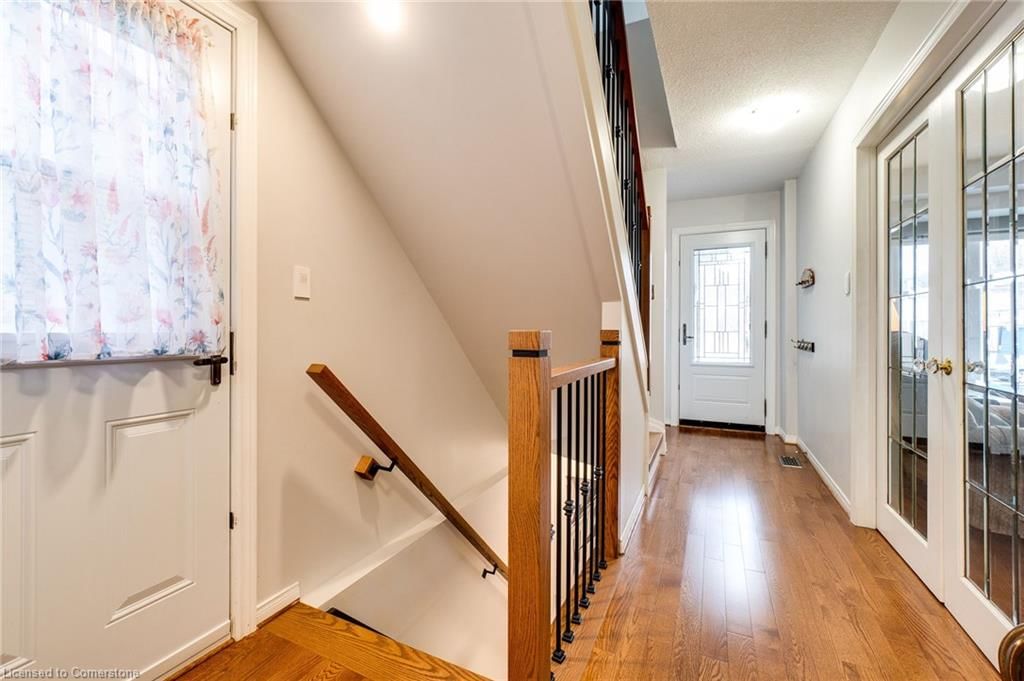
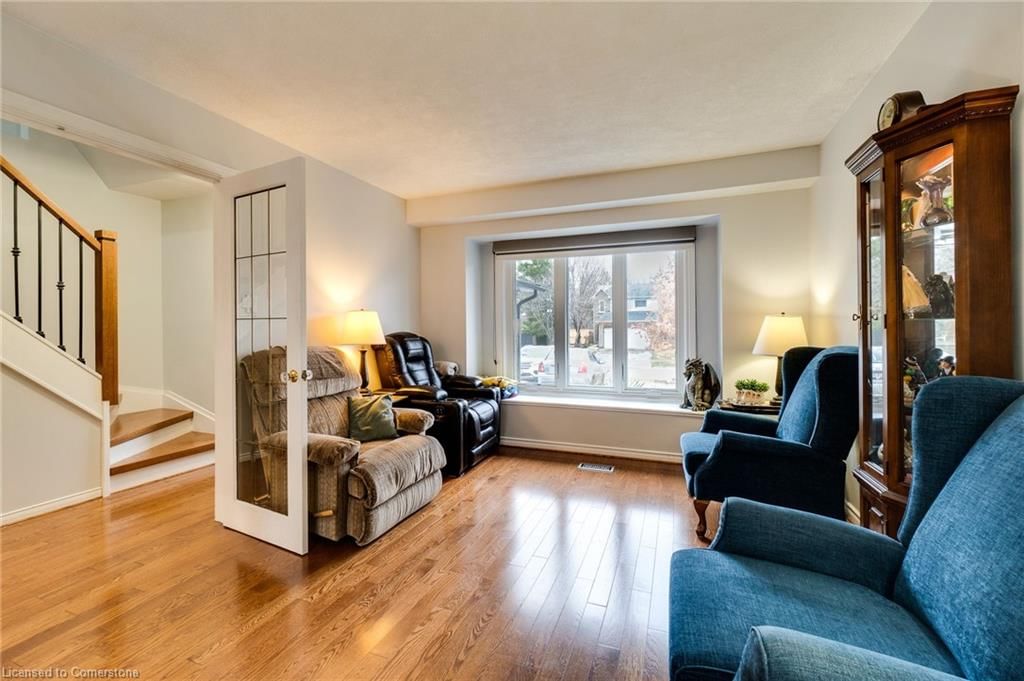
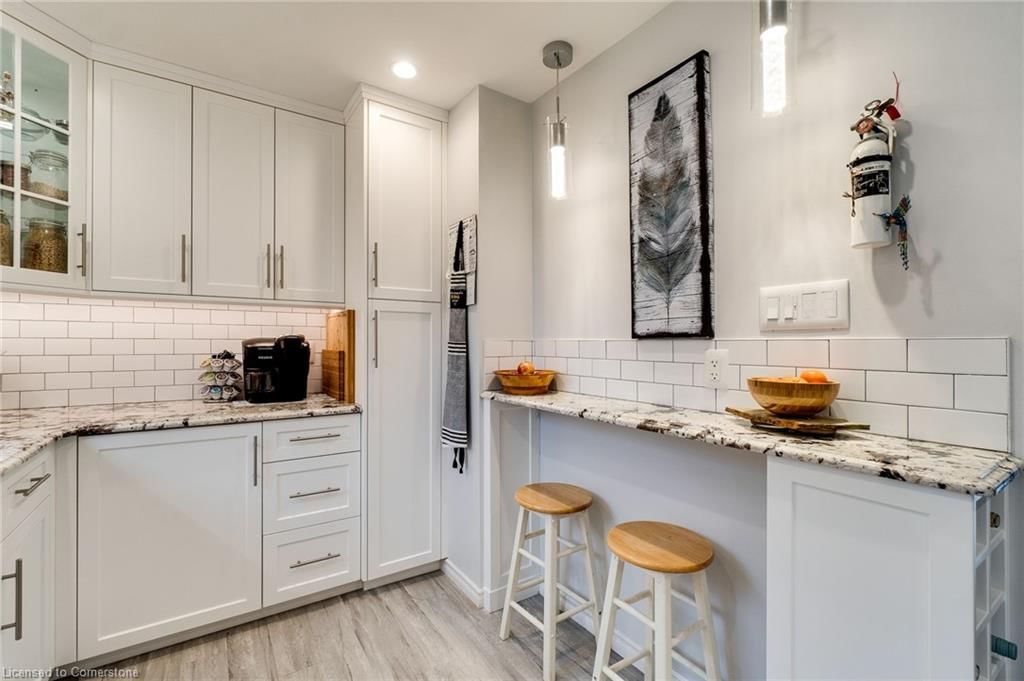
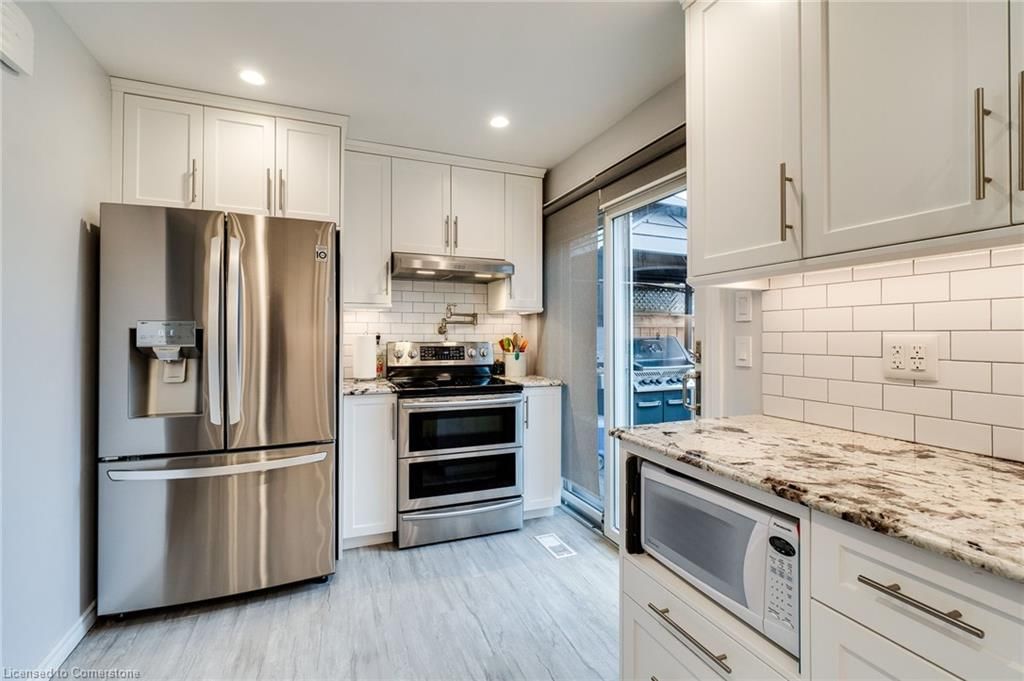
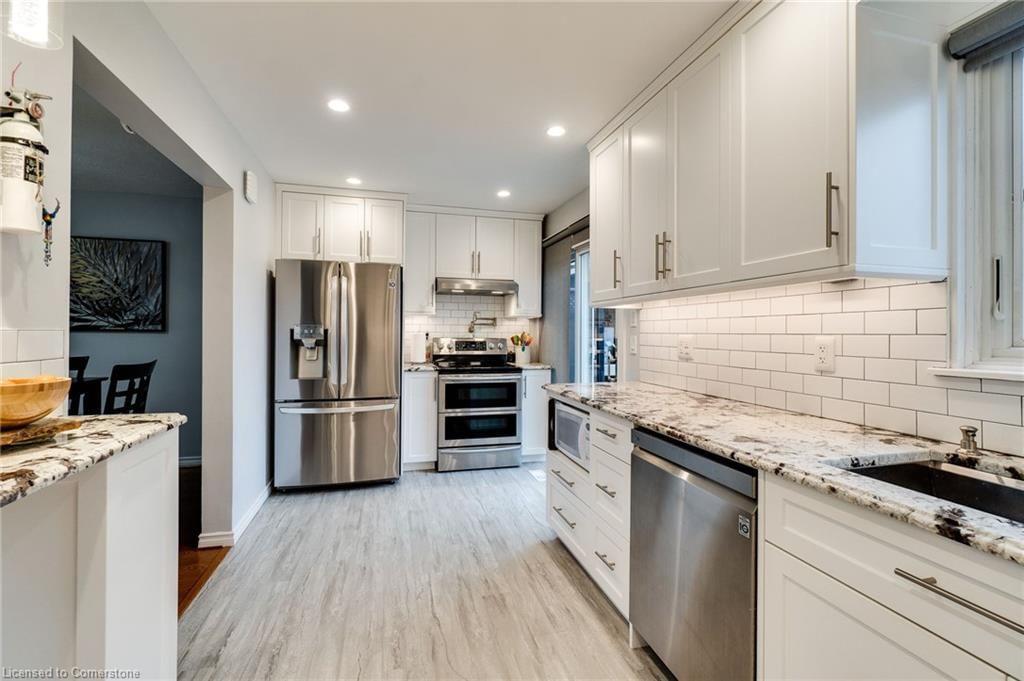
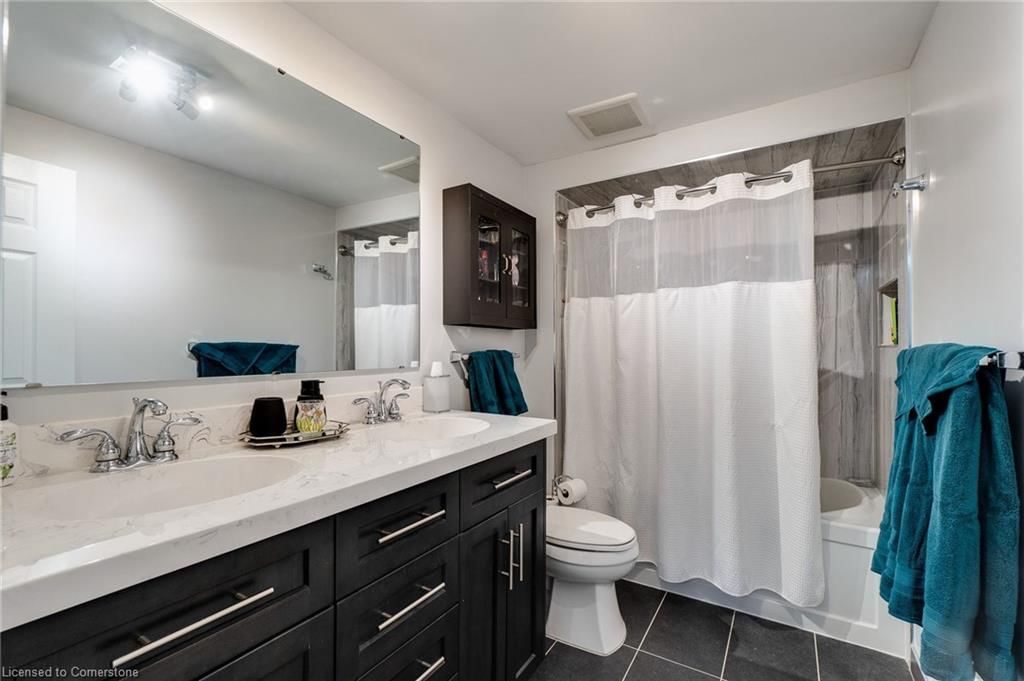
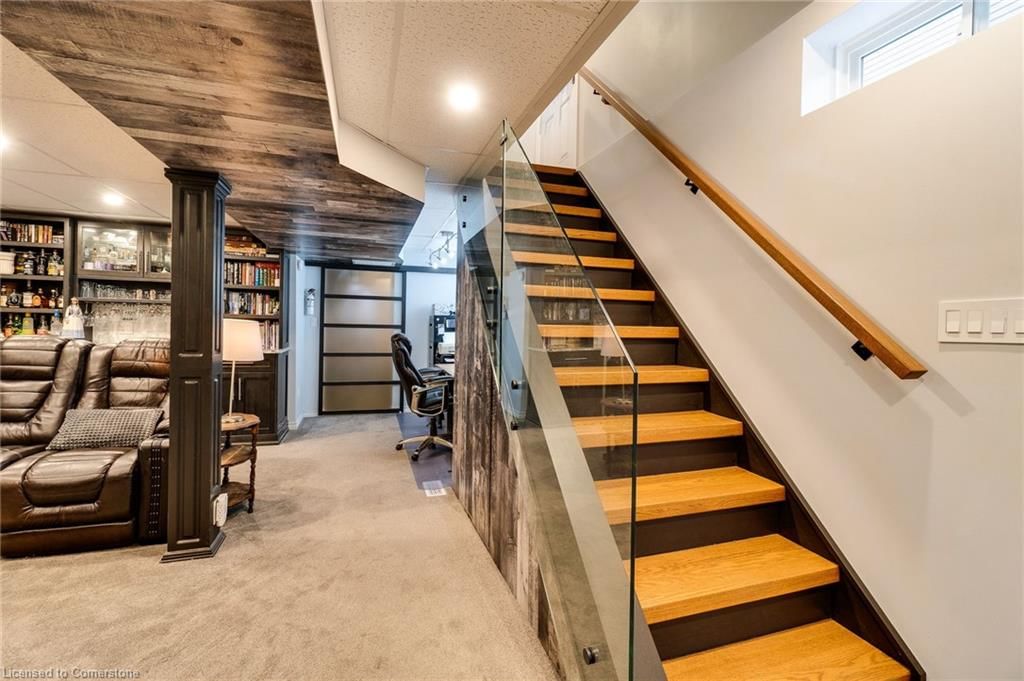
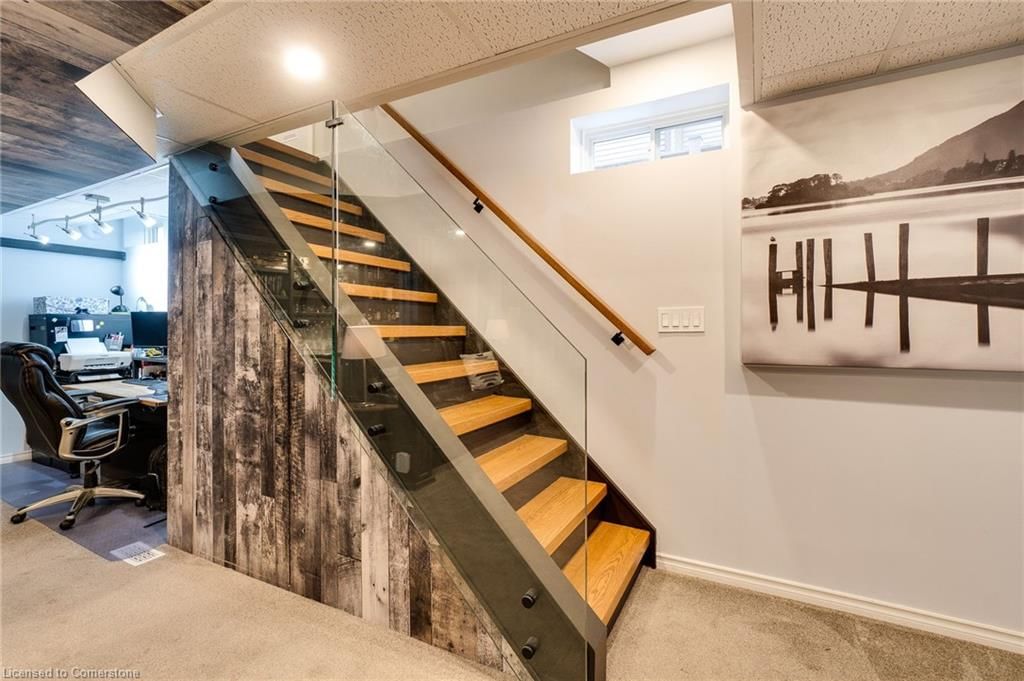
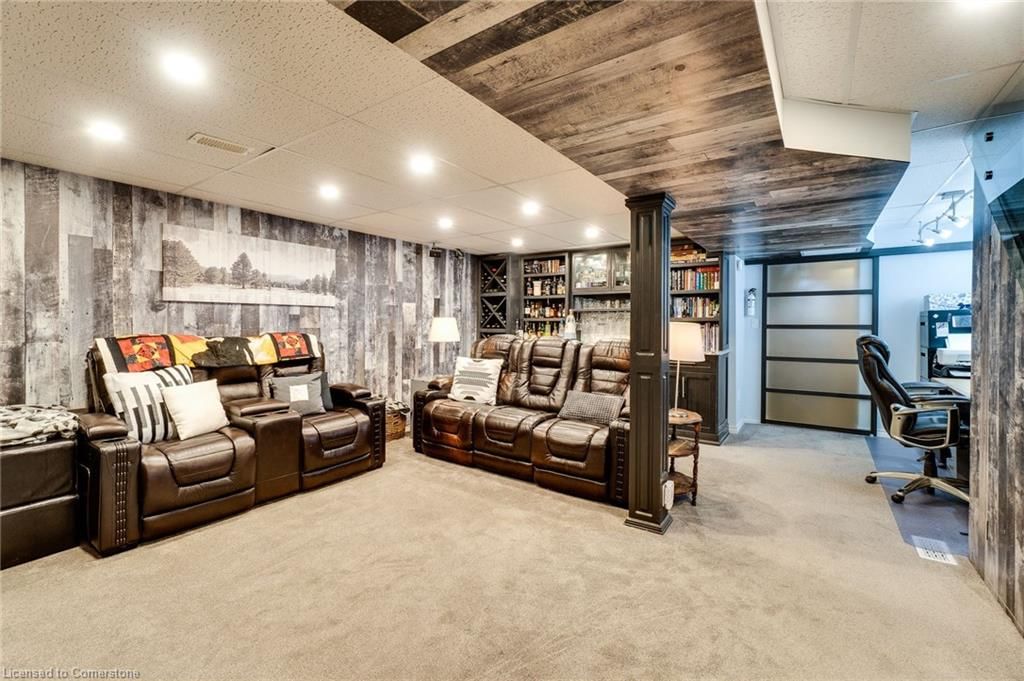
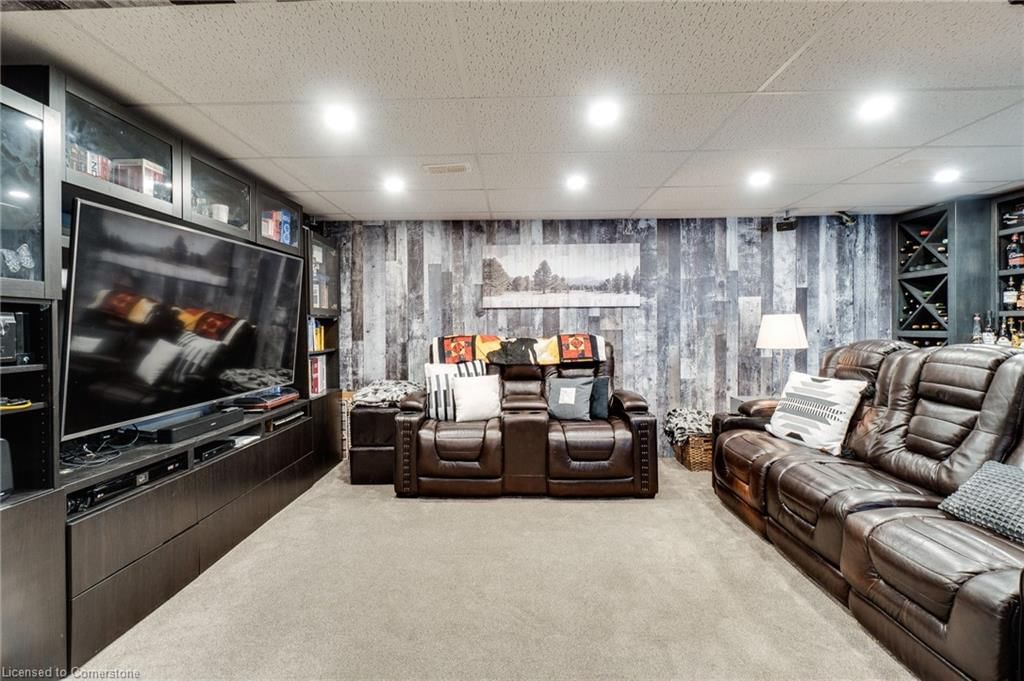
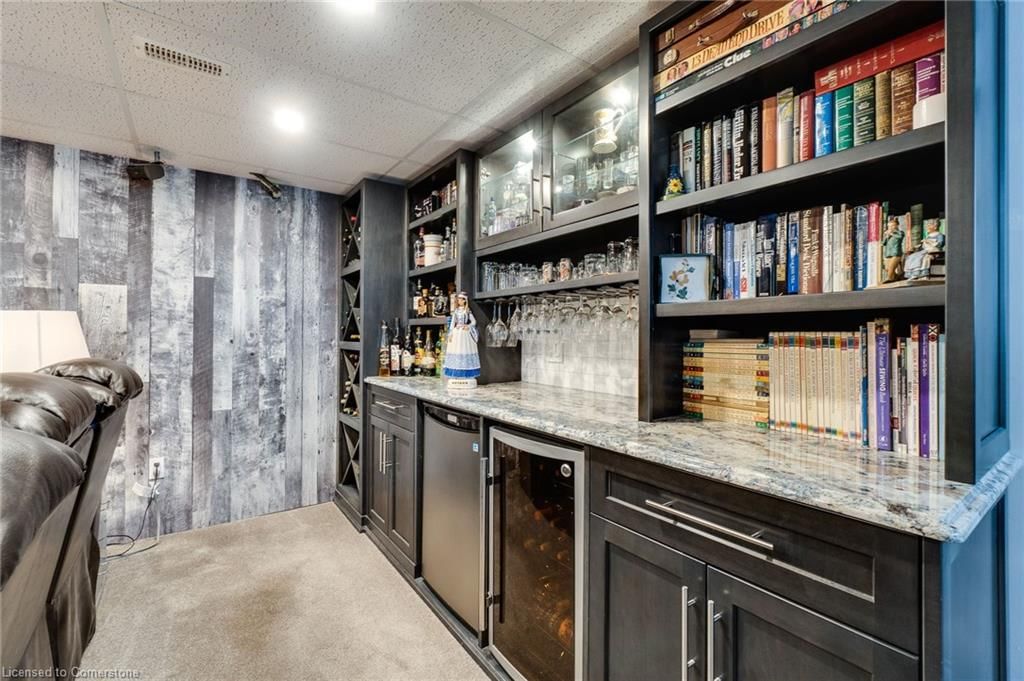
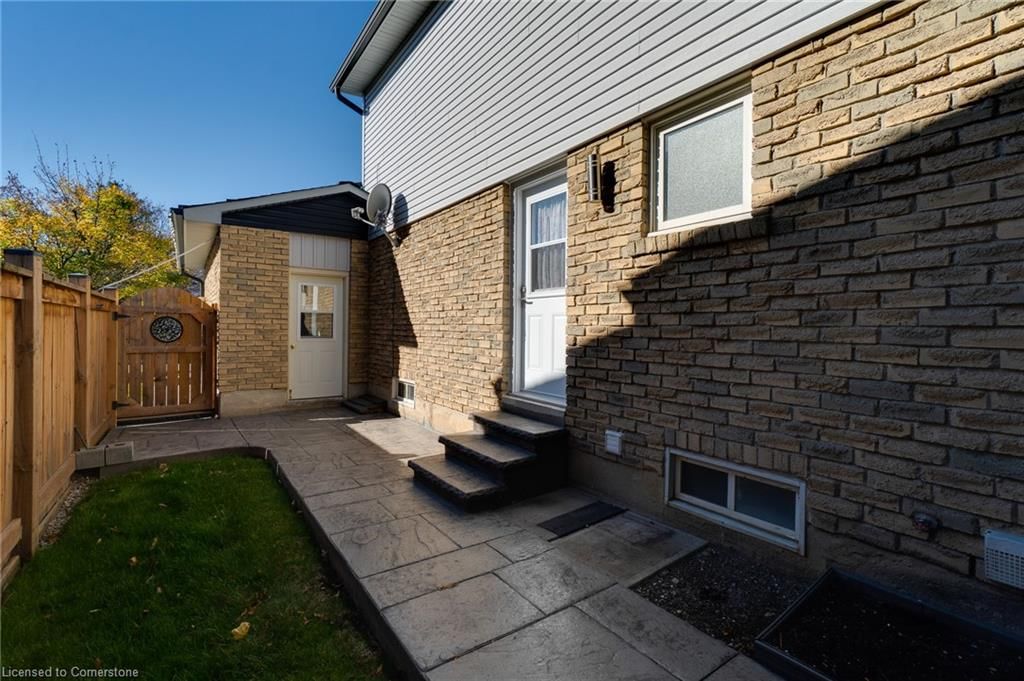
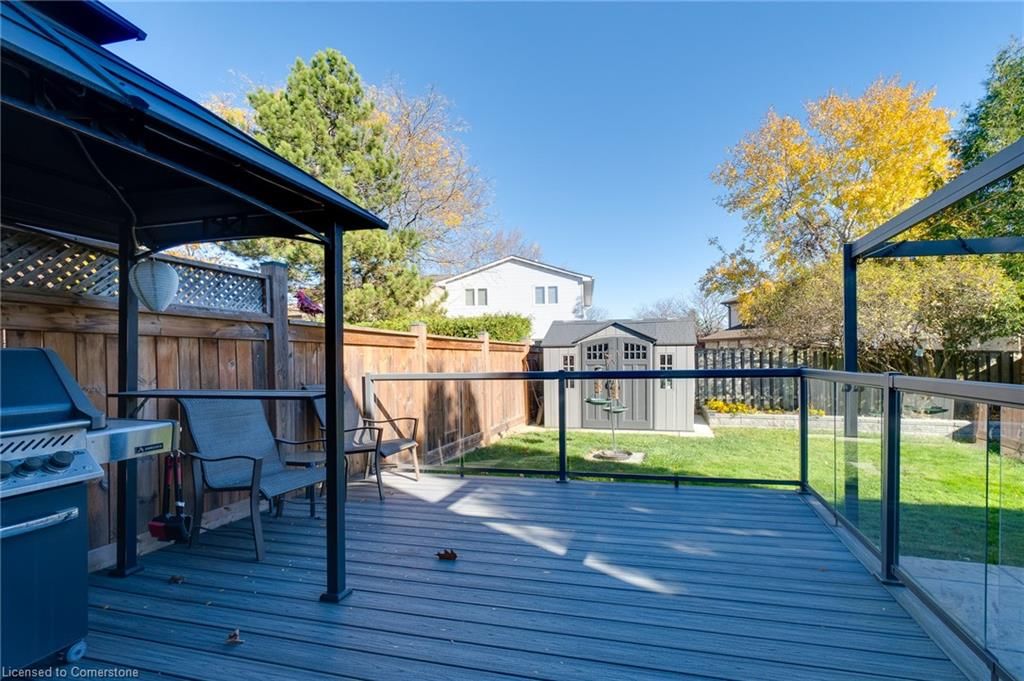
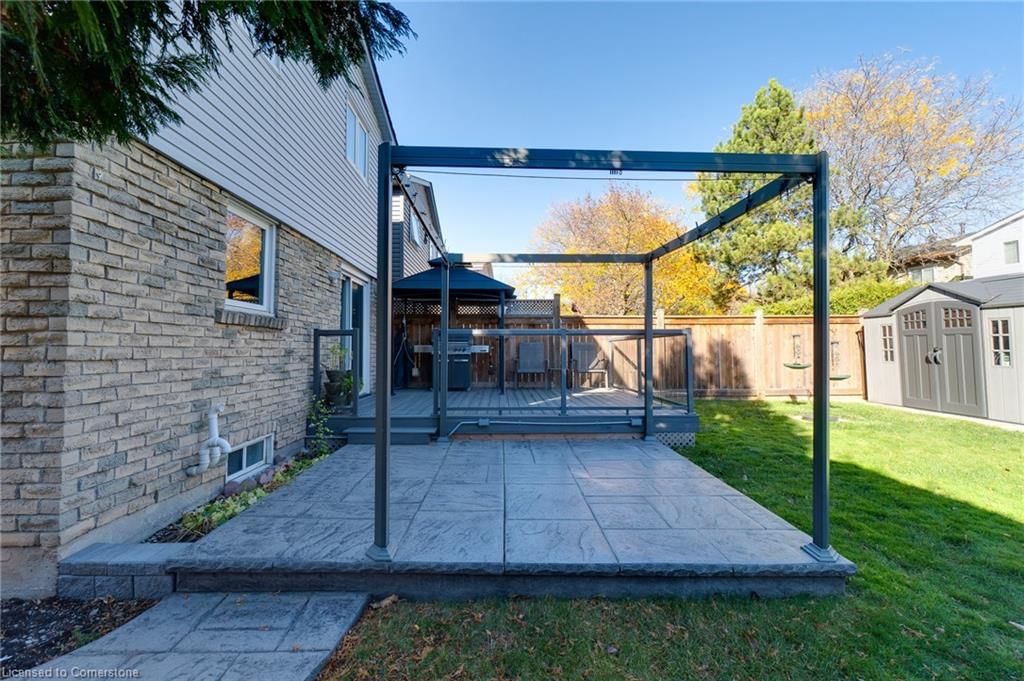
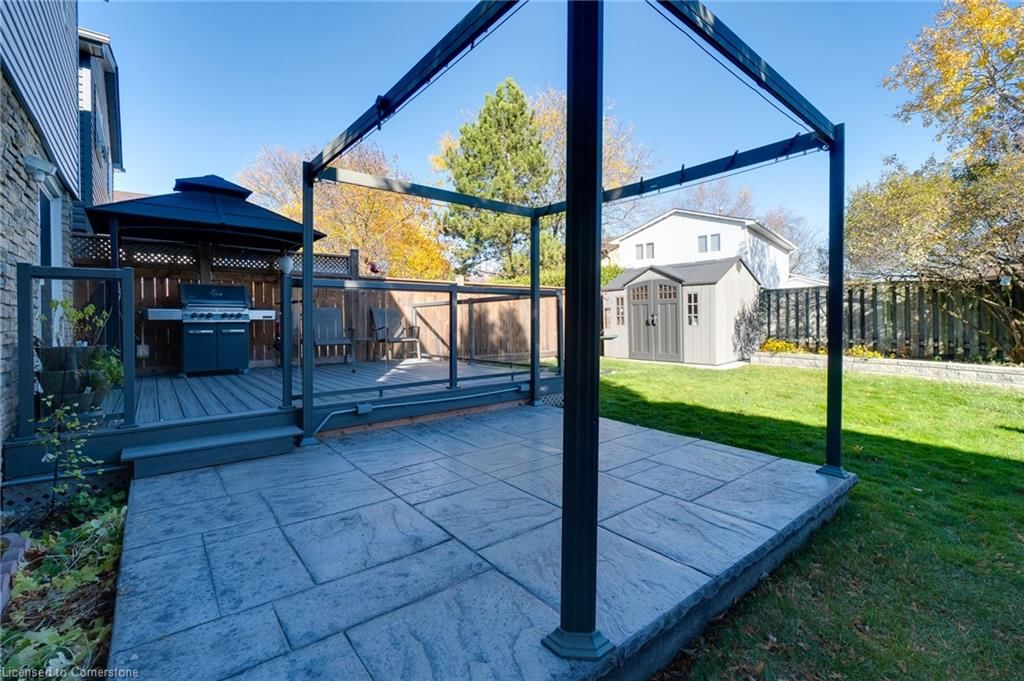
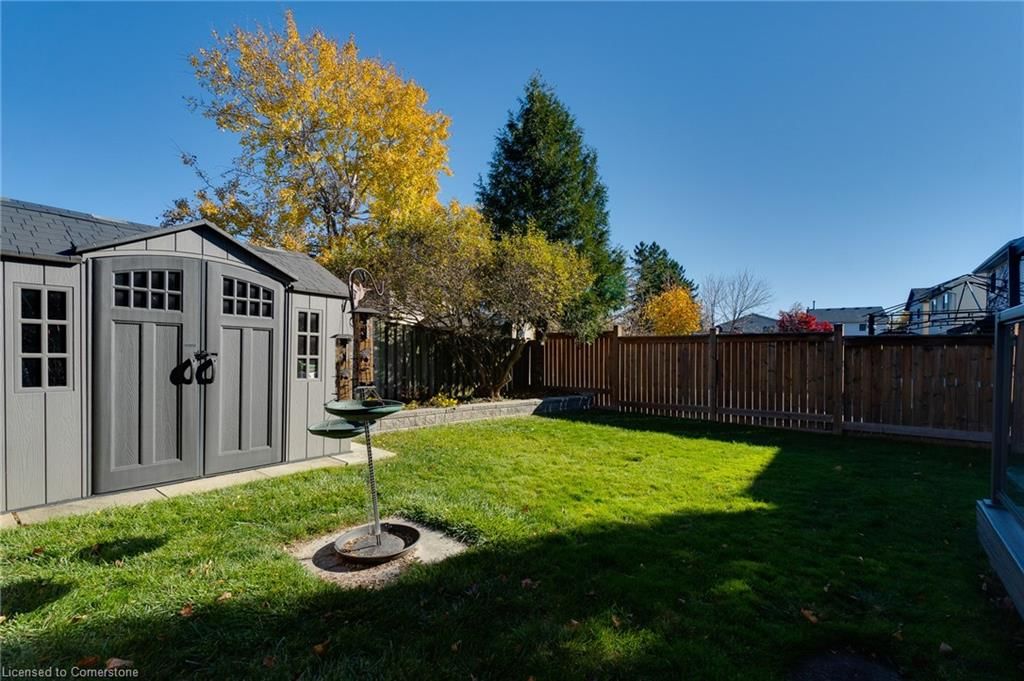
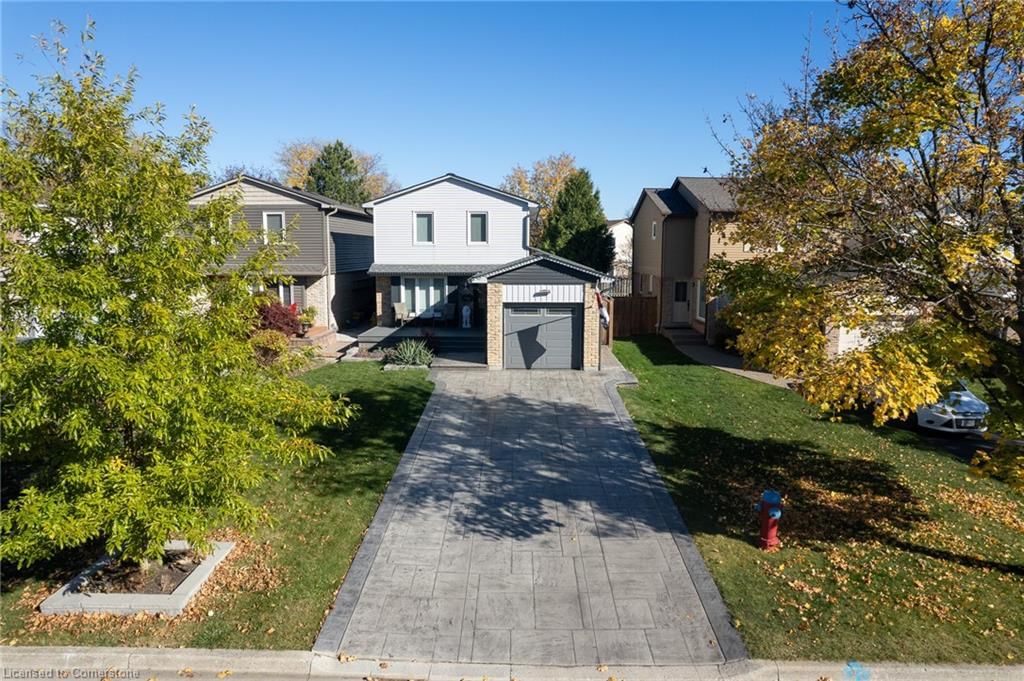
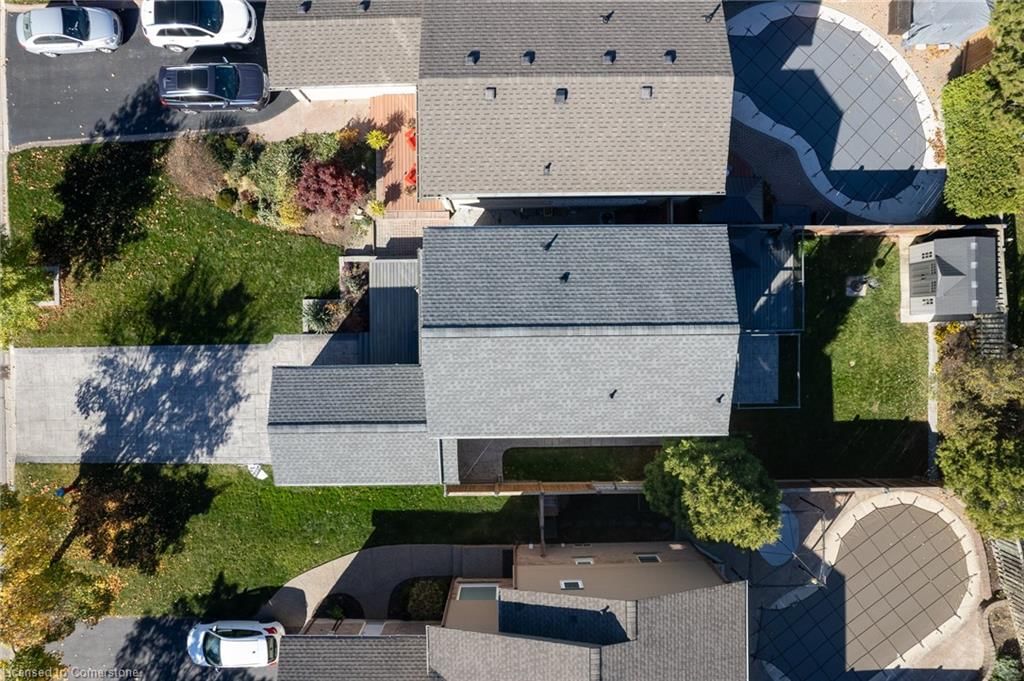
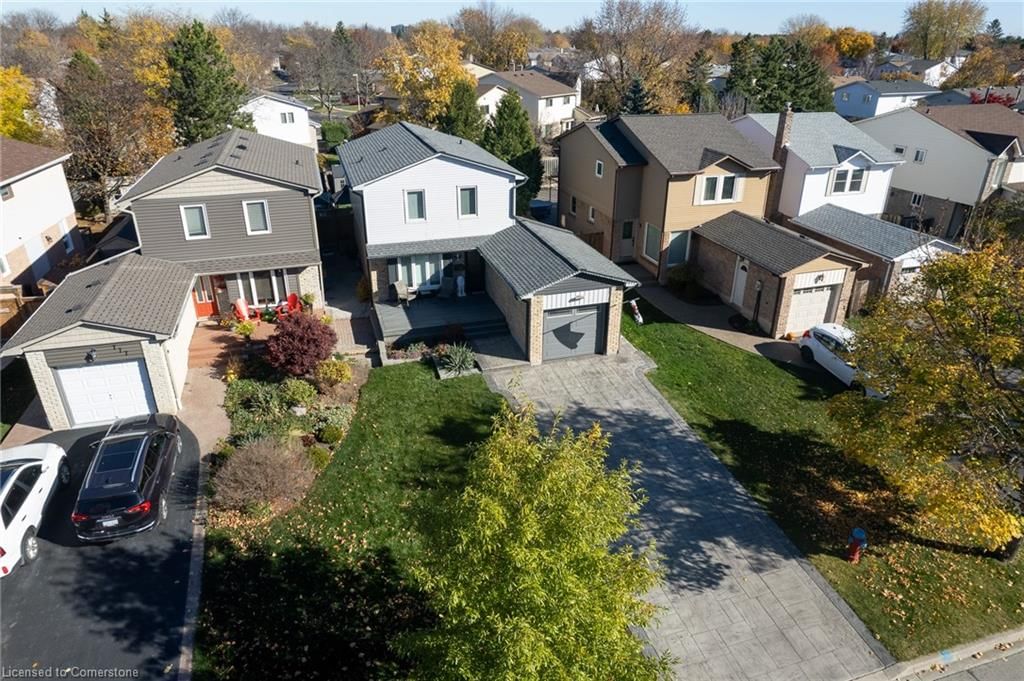
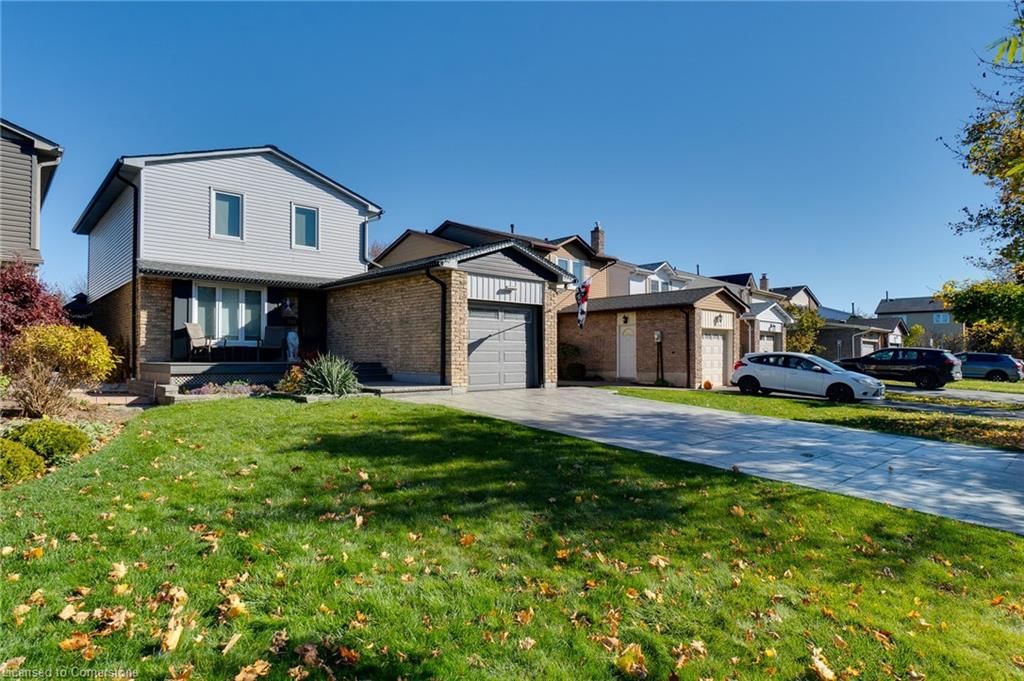
Features upgrades to lux standards all professional grade! Many upgrades include stamped concrete drive (2018) and patio and walkway, composite porch and deck (2018),outdoor faucet both sides of house,electrical updates on side of deck,2 gazebos and shed included,gas hook up for outdoor bbq with rotisserie, epoxy garage floor (2018), steel insulated garage door with side smart opener, hardwood floors 1st & 2nd floor, 2 easy access to backyard, freshly painted , kitchen many upgrades including granite countertops,roll out trays & drawer organizers, lazy susan optimized rotating shelf, pot filler at double oven stove,pot lights almost everywhere, bar & entertainment centre, speakers in family rm, upstairs bathroom total upgrade 2017 with custom dbl sink vanity , custom drawers, bar in bsmnt features granite counter top with 2 built in fridges, glass railing on stairs is removable for ease of moving furniture, hi efficiency furnace -age of windows 2017 -electrical panel 2014 with surge protector
Carbon Monoxide Detector,Dishwasher,Dryer,Freezer,Garage Door Opener,Range Hood,Refrigerator,Satellite Dish,Smoke Detector,Stove,Washer,Window Coverings,Wine Cooler,Wifi Extender Link, Gazebo & Top, Bbq Gazebo, Shed, Bsmnt Bar Fridge,Speakers In Bsmnt, Entertainment Centre In Bsmnt,Under Kitchen Cabinet Recycling Garbage Containers, Gas Bbq & Rotisserie,Shelf To Right Of Freezer In Bsmnt
Copyright 2025 Information Technology Systems Ontario, Inc. The information provided herein must only be used by consumers that have a bona fide interest in the purchase, sale, or lease of real estate and may not be used for any commercial purpose or any other purpose.
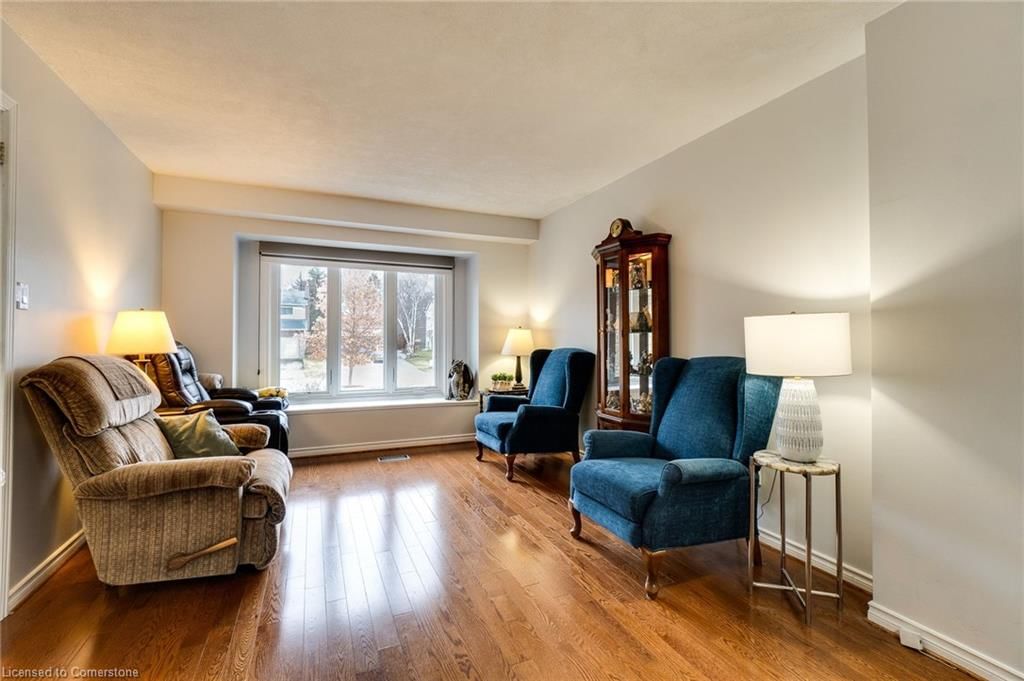
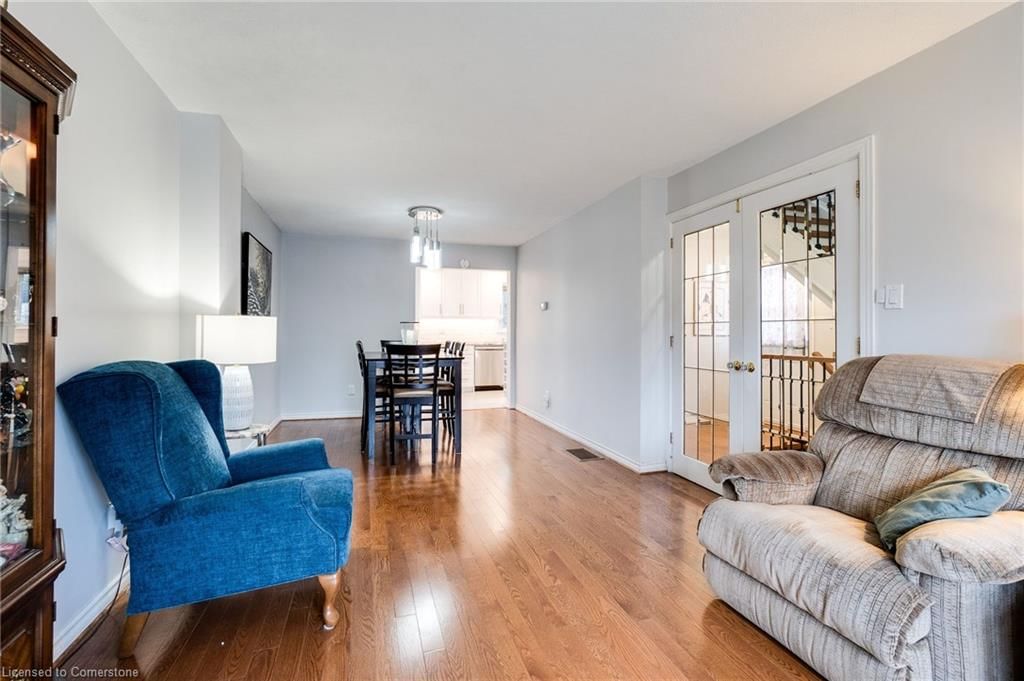
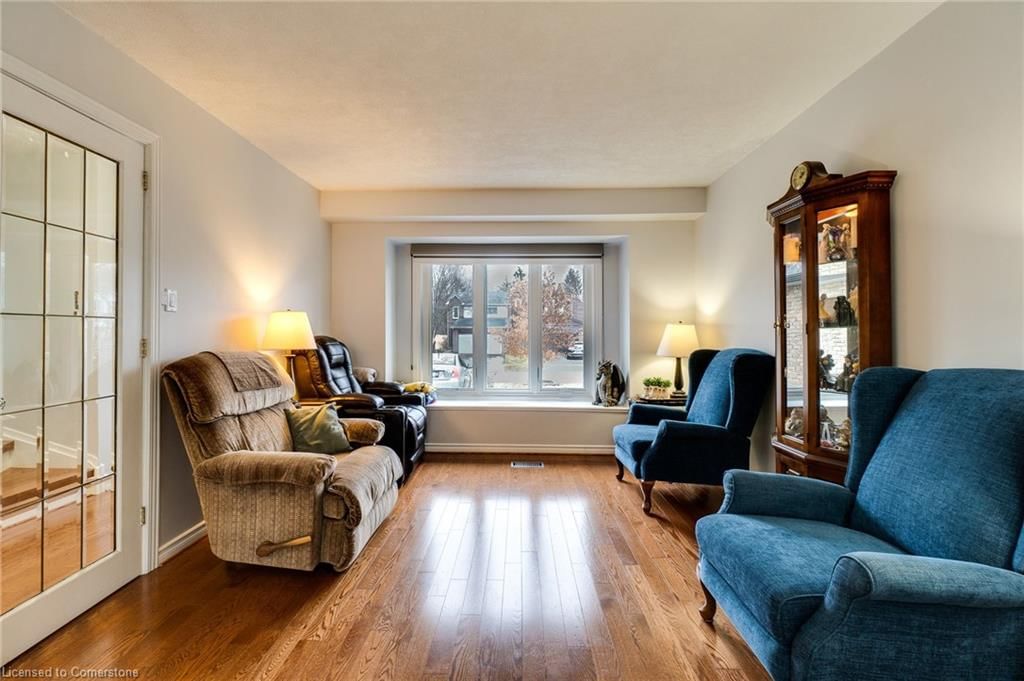
Living Room
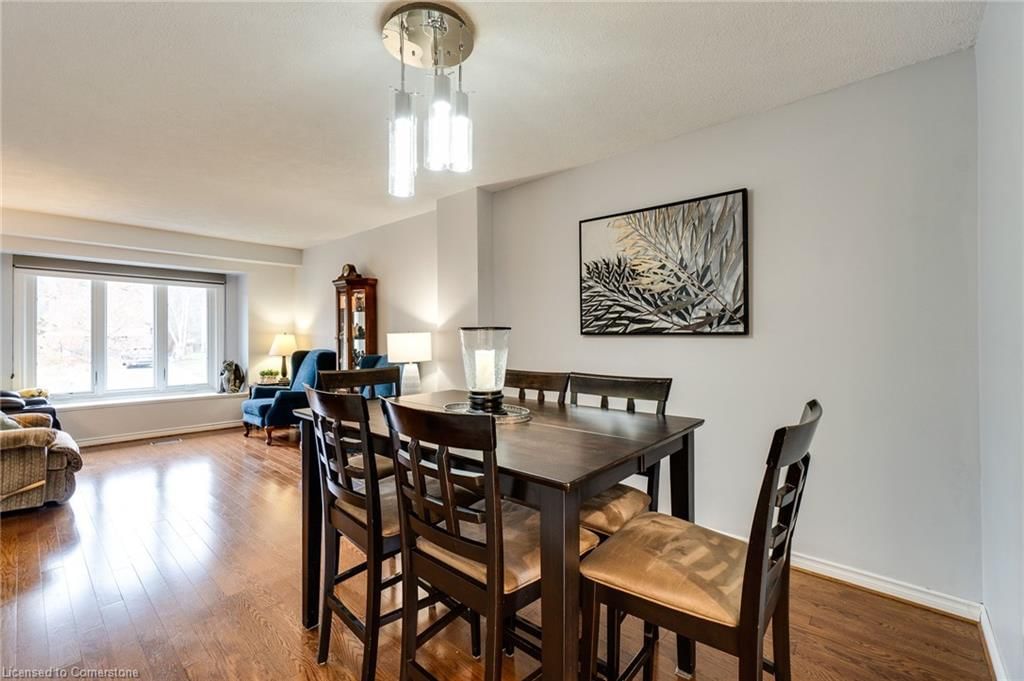
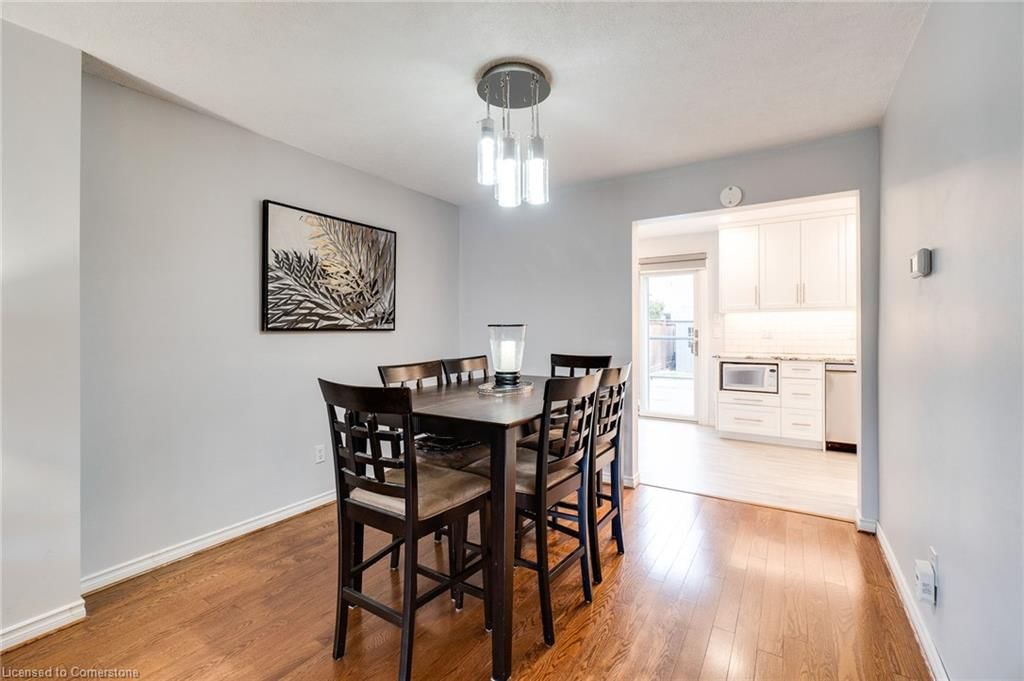
Dining Room
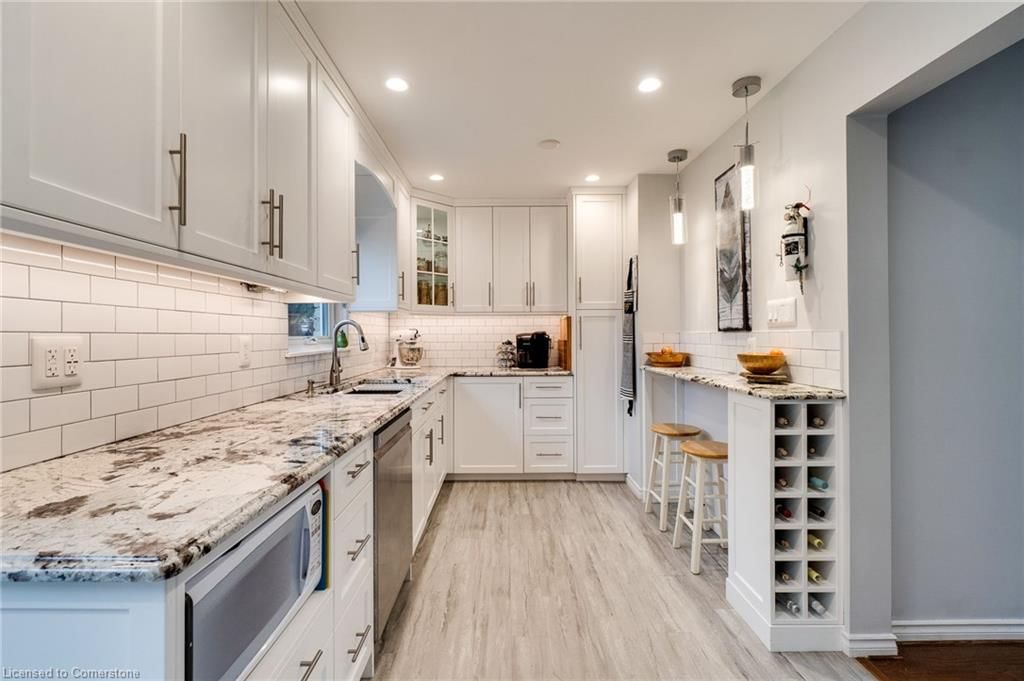
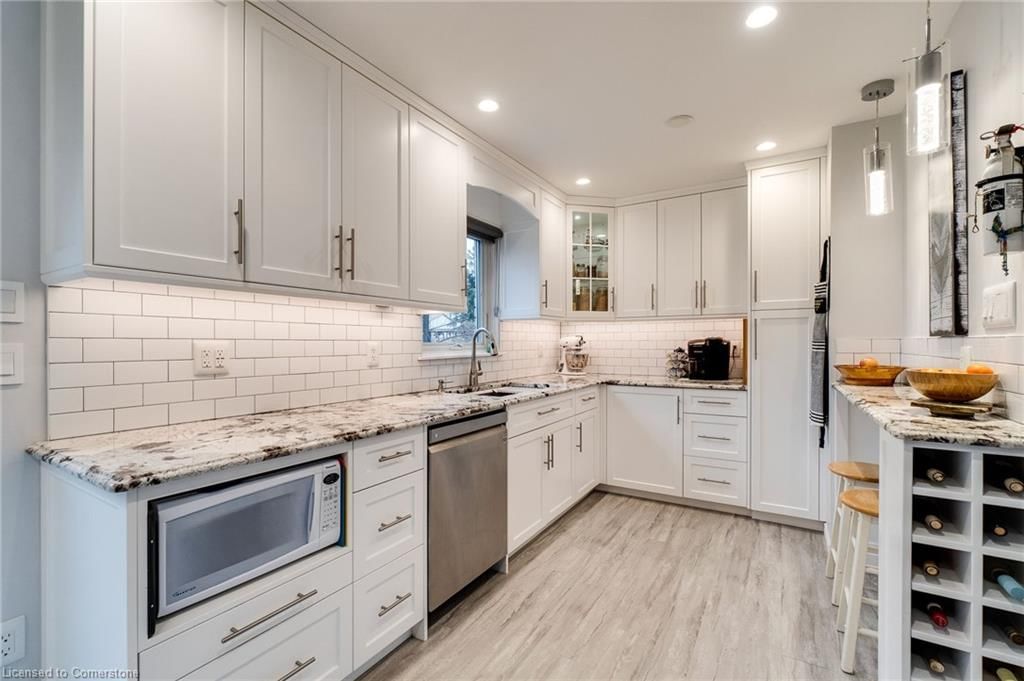
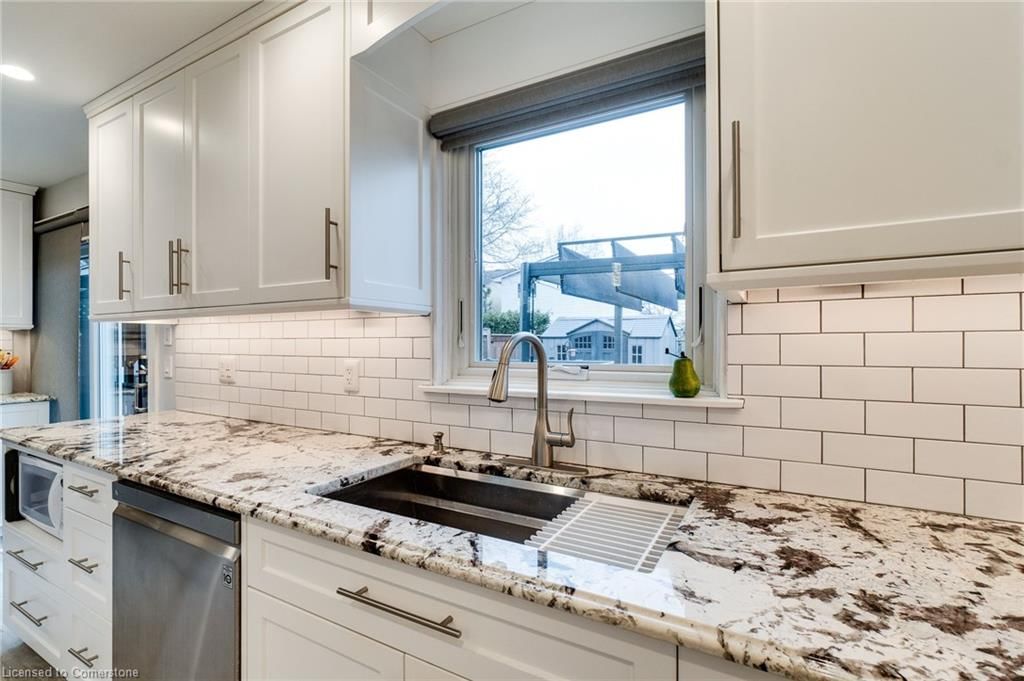
Kitchen
Bathroom
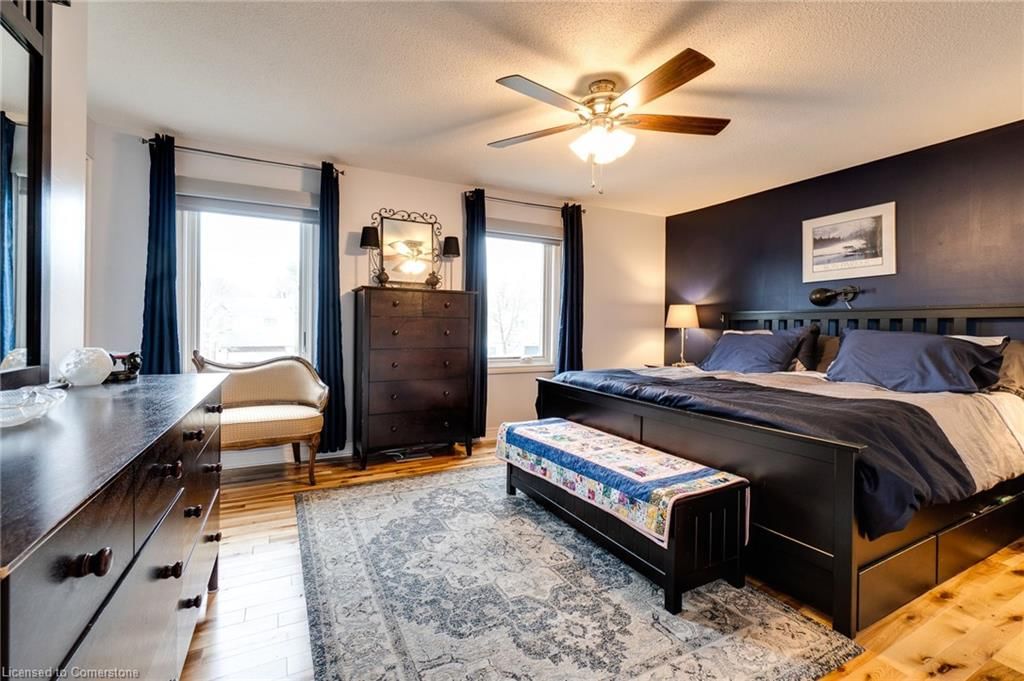
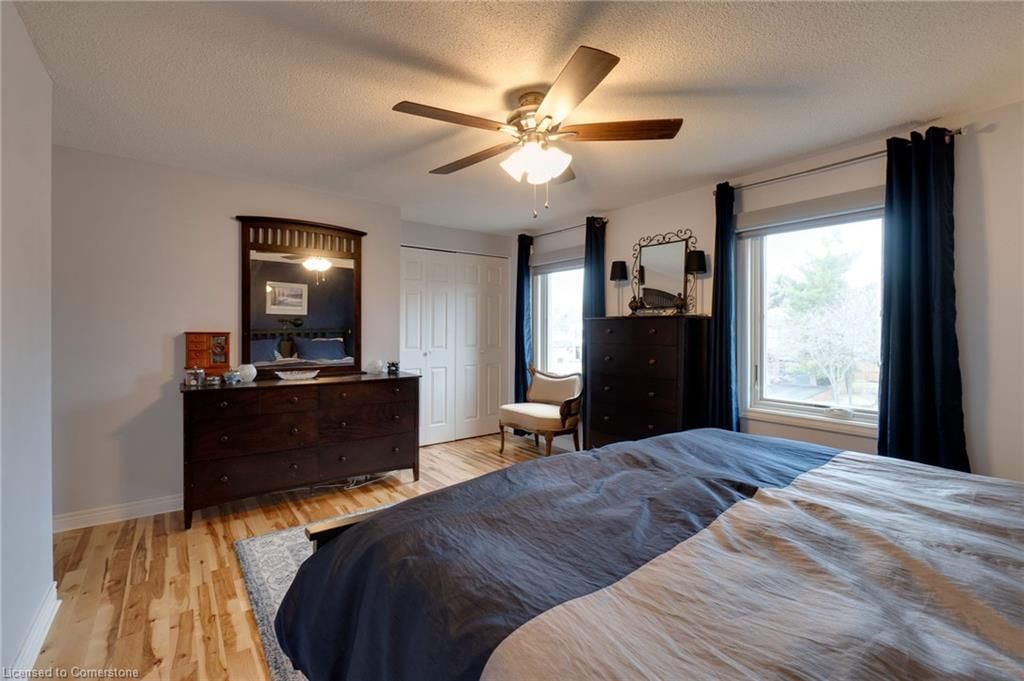
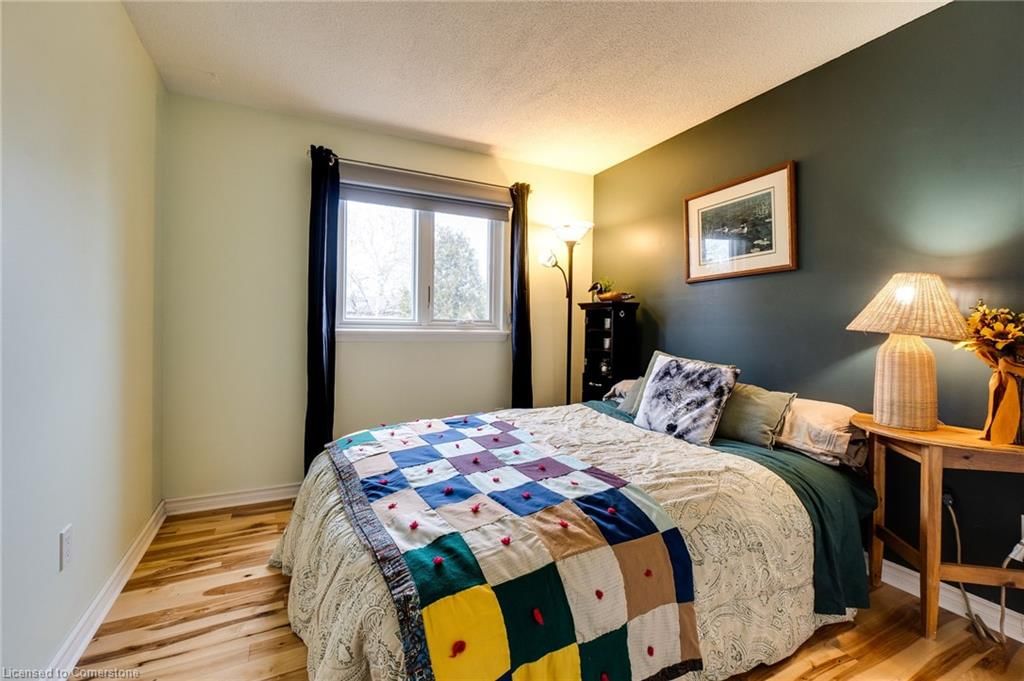
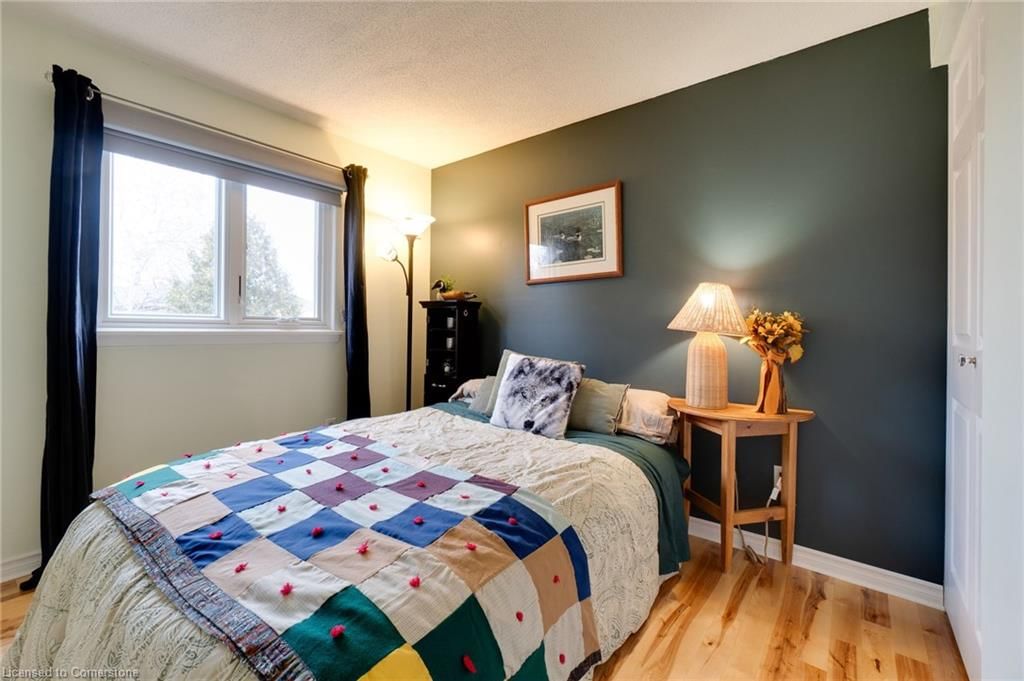
Bedroom Primary
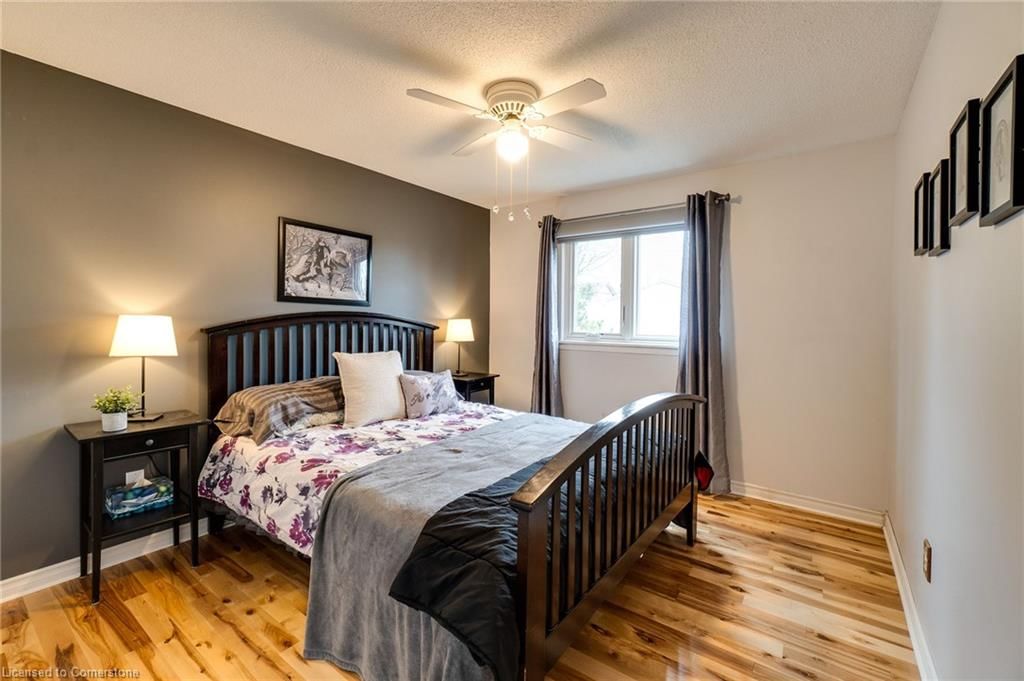
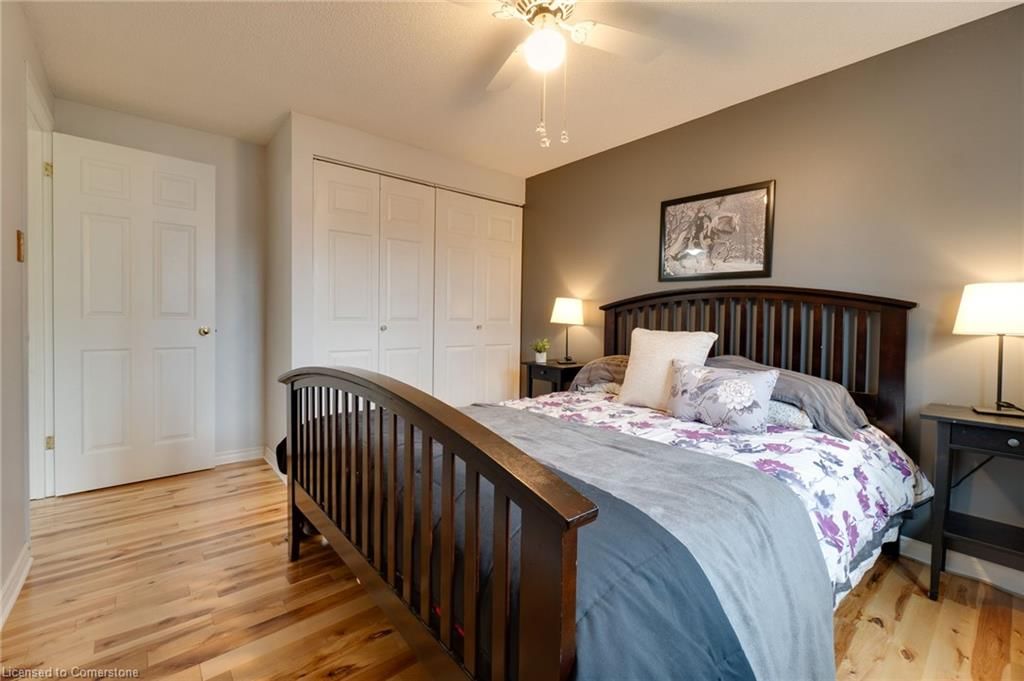
Bedroom
Bedroom
Family Room
Utility Room
Bathroom
The graph below compares the average list price and average sale price of homes in this neighborhood by month for the last 24 months. When average sale price is greater than average list price, this may suggest a buyer's market. When average sale price is lower than the average list price this may suggest a seller's market.
The graph below illustrates the average days on market for homes in this neighborhood. The yellow area may indicate a buyer's market, the green area may indicate a balanced market and the red area may indicate a seller's market.
Sales Representative, Century 21 People’s Choice Realty Inc., Brokerage
(647) 576 - 2100